
When EMG signal data becomes visible in real time, fitting stops being a trial-and-error process. This is what clinicians can see, what it means, and when it changes the decision they make next.
Myoelectric fitting has traditionally been an experience-dependent process. Signal quality is assessed through palpation and patient feedback, electrode placement is adjusted by feel, and calibration is confirmed when the hand moves the way the clinician expects. There’s expertise in that approach, but there’s also a ceiling on what it can reliably tell you.
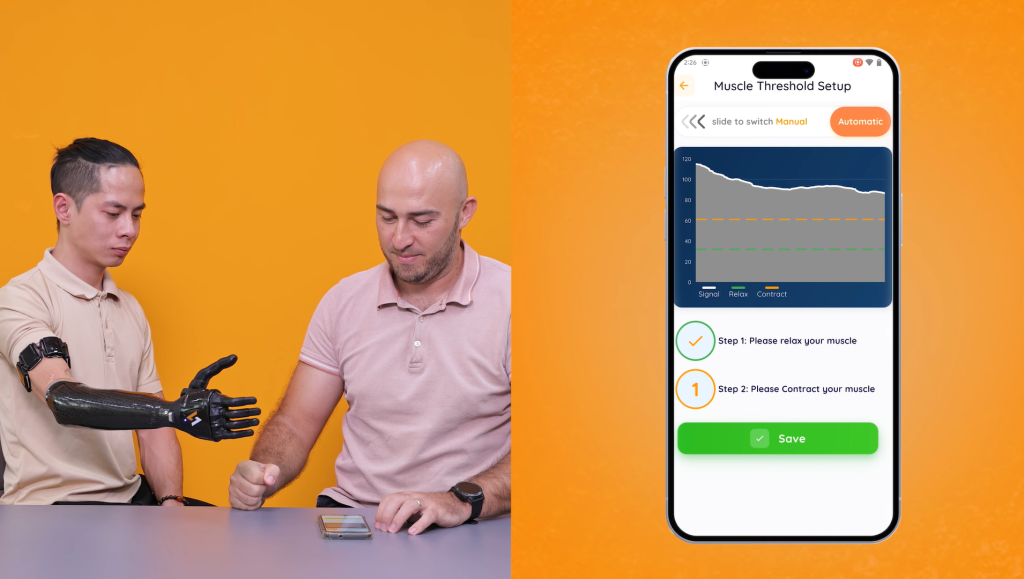
When EMG signal data is visible in real time, waveforms on screen, contraction timing captured as it happens, motion data updating continuously, the clinical picture changes. Decisions that were previously made by inference can be made on observation. This article is about what that visibility actually shows, how to read it usefully, and where it changes the decisions that matter in fitting and follow-up.
What Fitting Looks Like Without Signal Visibility
In a conventional myoelectric fitting, a clinician’s understanding of the patient’s EMG signal is largely indirect. They can feel for muscle activity through palpation. They can watch the hand respond during calibration and draw conclusions from the response. They can ask the patient to contract and observe whether the movement is what they expected.
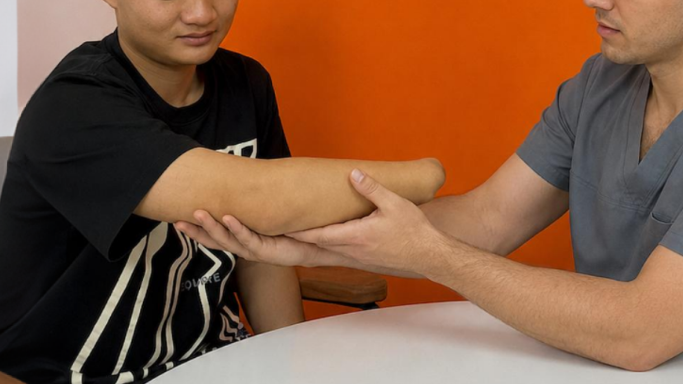
This works reasonably well when the patient has clear, strong signals and cooperative anatomy. It becomes progressively harder to rely on when signals are weak, inconsistent, or distributed across the limb in ways that aren’t easy to locate by palpation alone.
Without real-time signal visualization
- Electrode placement guided by palpation and experience
- Signal quality inferred from device response
- Calibration confirmed when hand movement looks right
- Between-session signal changes discovered at return visits
- Candidate assessment based on observed device response
With real-time signal visualization
✓ Signal quality confirmed at each candidate site before placement
✓ Contraction strength and timing visible directly
✓ Calibration based on measurable activation data
✓ Signal trends reviewable at follow-up
✓ Candidacy confirmed or ruled out objectively before fabrication
Five Clinical Decisions That Signal Visualization Directly Supports
Real-time EMG visibility isn’t a single-use tool. It supports different clinical questions at different stages of the fitting process — from the very first evaluation through to long-term follow-up.
01. Pre-fabrication candidacy assessment
Before investing time in socket fabrication, visualizing actual EMG signal output allows clinicians to confirm whether a patient can generate consistent, usable signals and from which sites. Patients who appear marginal on palpation alone may produce viable signals when assessed with objective data.Reduces misclassification risk. Reduces misclassification risk
02. Signal site selection
Comparing signal quality across multiple candidate sites — amplitude, consistency, noise ratio — allows for more systematic site selection rather than relying on the first viable location found. Particularly useful for patients with atrophy, scar tissue, or short residual limbs where signal distribution may be less predictable. Reduces myosite hunting time
03. Calibration quality confirmation
Visual feedback during calibration lets the clinician see whether contraction and relaxation levels are being captured cleanly, and whether the patient’s activation pattern is consistent enough to support reliable control. Calibration that looks correct on the device may still have underlying signal variability worth addressing. Evidence-based calibration
04. Patient engagement in training
When patients can see their own muscle activity in real time, motor relearning accelerates. Visual biofeedback, the patient seeing their contraction register on screen, supports neuromuscular re-engagement in ways that verbal cues alone typically don’t. This is particularly relevant for long-term amputees returning to myoelectric use.
05. Follow-up signal trending
Reviewing stored signal data at follow-up appointments gives clinicians a longitudinal view of how a patient’s activation patterns have changed. Signals that were marginal at fitting may have strengthened with use and training, or may have degraded, pointing to limb changes that need to be addressed.
A Practical Signal Assessment Workflow
The following steps reflect general clinical practice for EMG signal assessment during myoelectric fitting, applicable regardless of which visualization tool or sensor system a clinic uses. The underlying principle is consistent: establish a baseline, compare sites systematically, test under real conditions, and document for follow-up.
1. Establish a resting baseline first
Before asking the patient to contract, observe the signal at rest. The resting baseline tells you the noise environment, and how clean the voluntary contraction signal will need to be to be distinguishable from it.
2. Map multiple candidate sites systematically
Rather than confirming the first viable signal and moving on, compare at least two to three candidate sites before selecting. The best available site may not be where you’d expect it from anatomy alone — particularly in patients with long-term limb loss or tissue changes.
3. Test under movement, not just at rest
Have the patient perform arm elevation, reaching, and load-bearing movements while monitoring signal quality. A site that looks clean in the static assessment may show significant positional sensitivity or crosstalk under dynamic conditions — which will matter the moment the patient uses the device at home.
4. Use the signal view during calibration, not just before it
Keeping the signal display active during calibration lets you see whether the patient’s activation pattern is settling into consistency or still varying. Inconsistency during calibration is easier to address before the settings are confirmed than after the patient has gone home.
5. Document the signal profile for follow-up comparison
A signal profile captured at fitting becomes a clinical reference point. At follow-up, comparing current signal data against the initial session tells you whether activation is strengthening, degrading, or stable, information that shapes the next set of clinical decisions.
Note: the specific steps and tools vary significantly between control systems. The workflow below applies primarily to threshold-based myoelectric systems using real-time signal visualization, the approach differs for pattern recognition systems, which have their own calibration and training protocols.
Signal Visualization in the Vulcan App
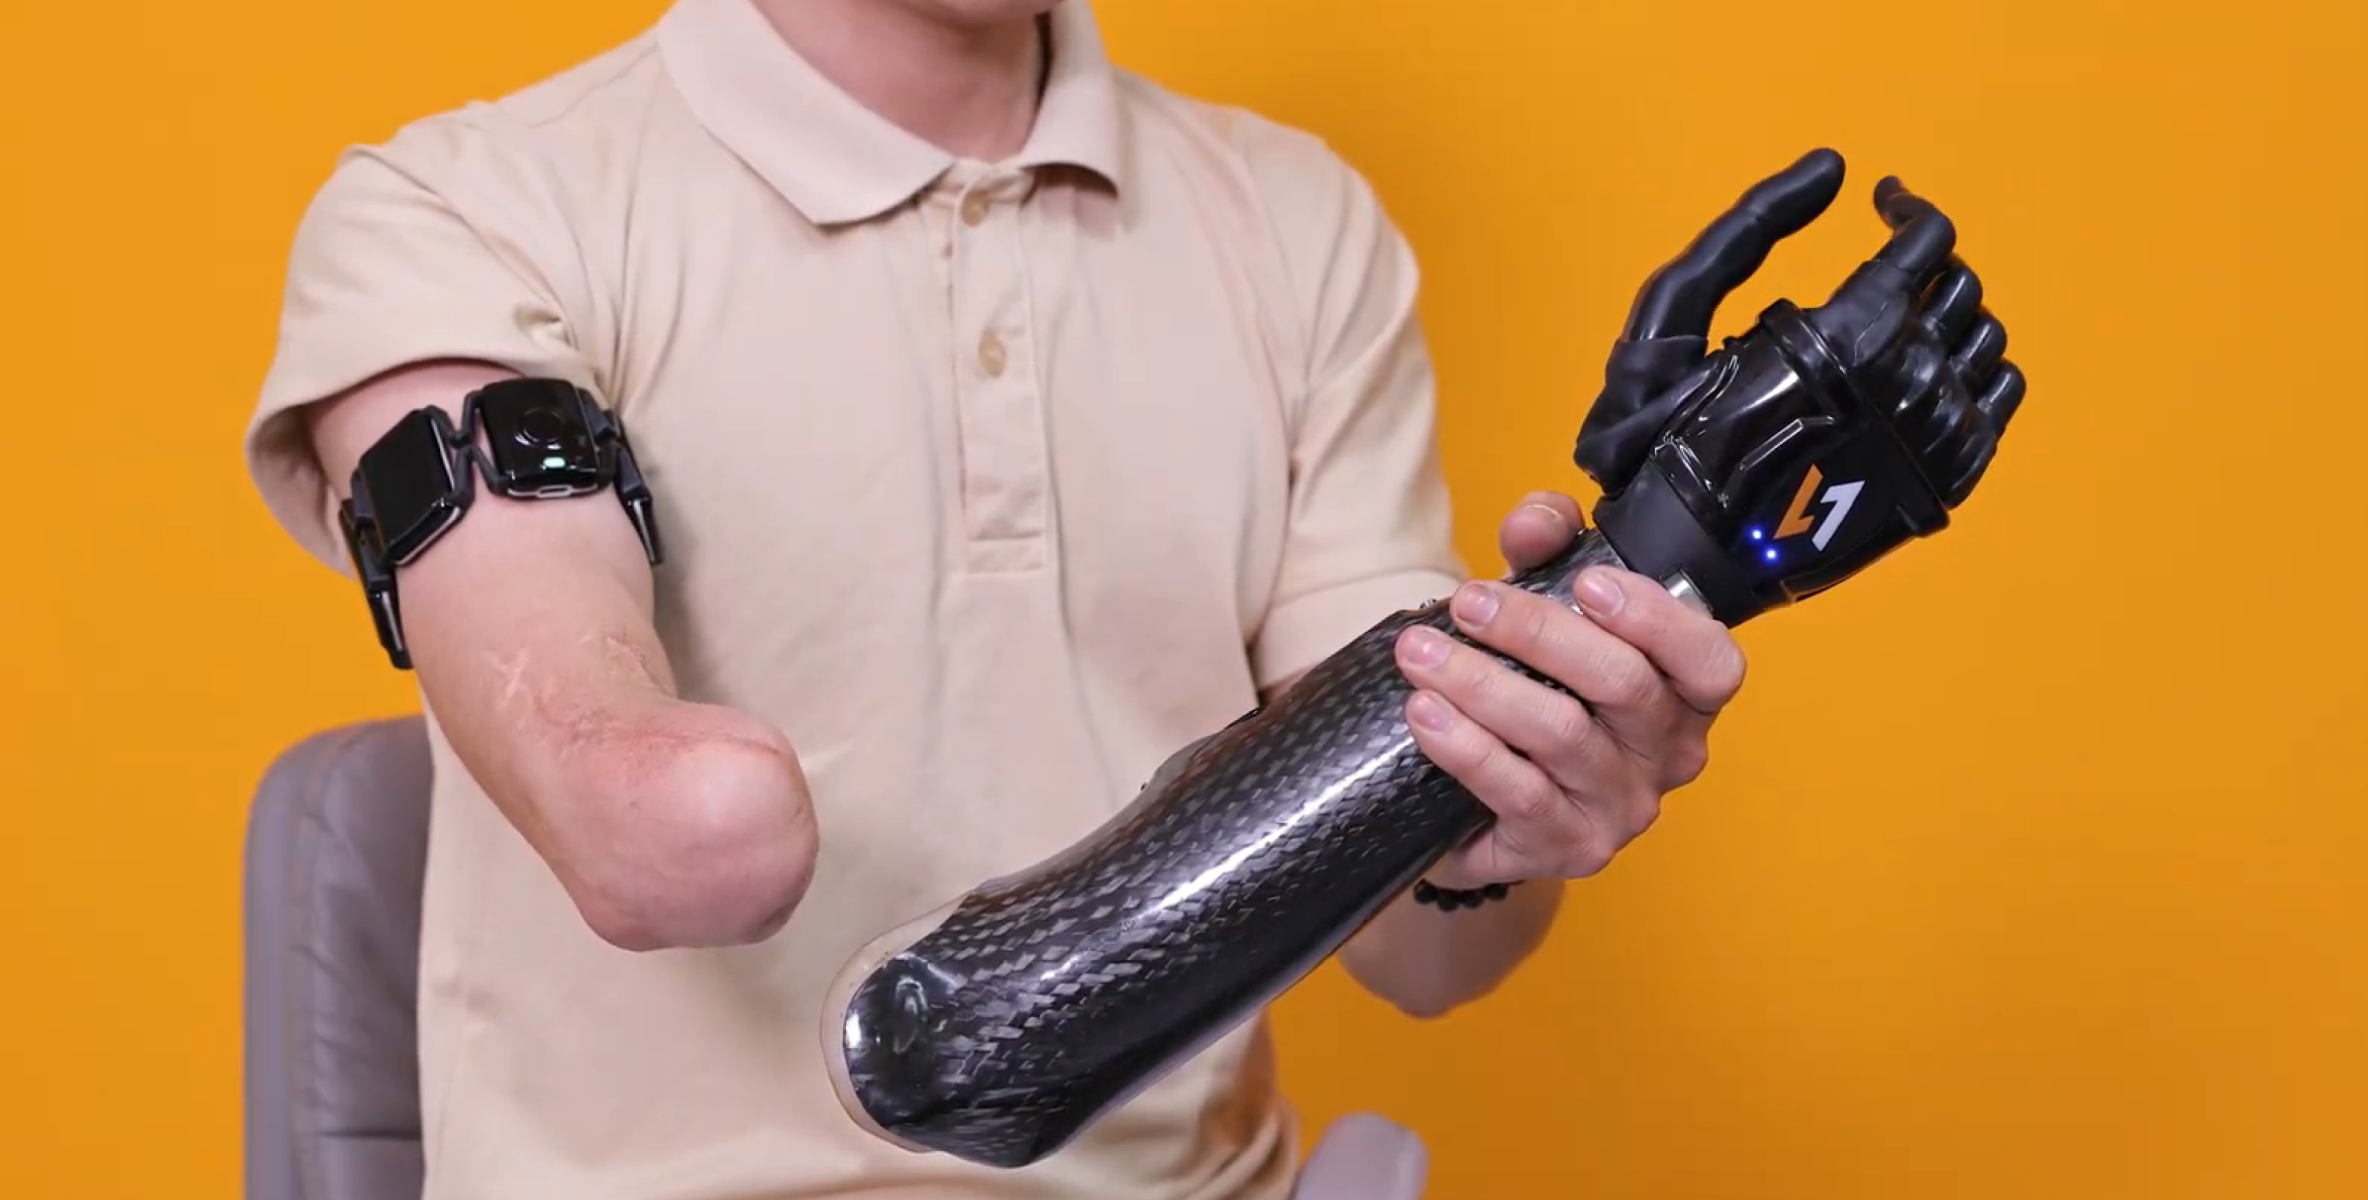
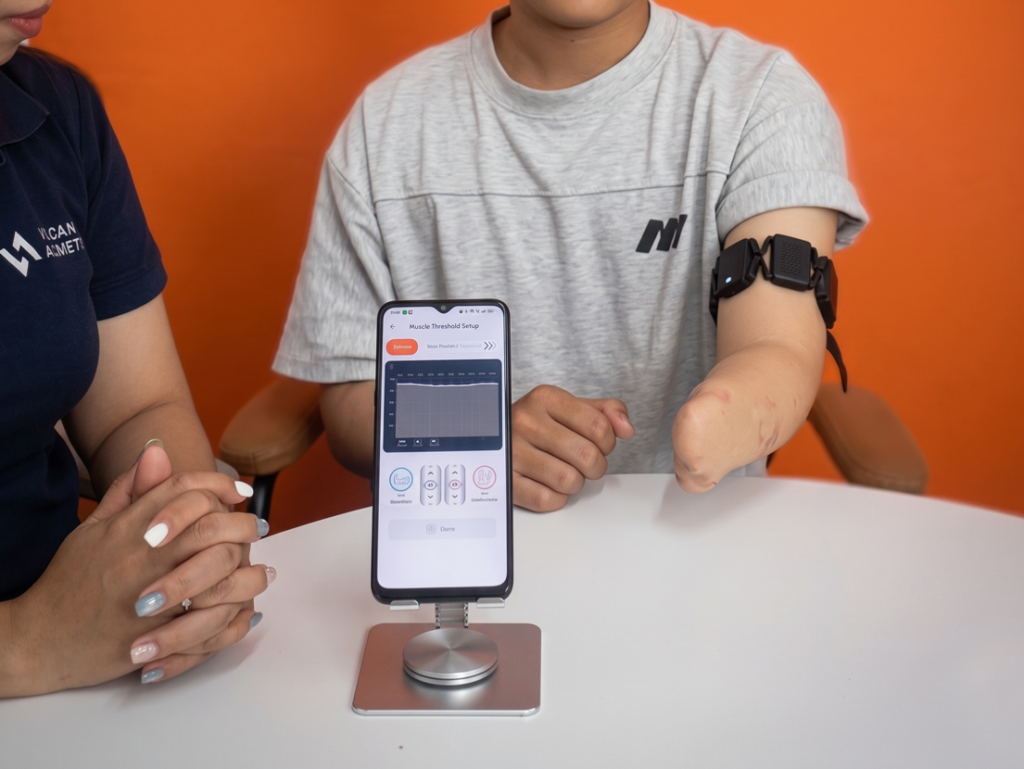
The Vulcan Myoband is designed to stream EMG data to the Vulcan app during fitting and calibration, giving clinicians a live view of muscle signal amplitude, contraction timing, and motion data during every stage of the fitting and calibration process. The signal history can be reviewed at follow-up appointments, supporting the kind of longitudinal tracking described in this article.
How Vulcan approaches signal-informed fitting
The app interface is intended to be accessible during a clinical appointment on a standard mobile device, the goal being to put signal data in front of the clinician without requiring additional diagnostic equipment or setup time.
As described in our overview of the Vulcan EMG visualization system, the same signal display that supports clinical decision-making can also be shown to patients during training, giving them a way to see their own muscle activity, which may support engagement with the rehabilitation process.